Is exporting huge amounts of wind power from the Great Plains a central feature in your vision of a modernized electric grid? For landowners, electric customers, climate activists, and rural and urban communities alike, one of the most qualified utility experts in the country has put that belief through long-overdue, acid tests.
On four occasions, speaking directly to the regional utilities that authored a multi-billion-dollar transmission expansion plan to market power to eastern U.S. utilities, Dr. David Patton has risen to voice severe warnings.1 Since 2005, Patton and his Potomac Economics team have served as the Independent Market Monitor for that regional planning — the outside watchdog whose job is to scrutinize it from inside the process. He is not the only skeptic: five Midwest state utility commissions have formally complained to federal regulators that their customers cannot be forced to pay for a misguided build-out.5
Their electric customers cannot be forced to pay for a misguided transmission build-out.— Five state utility commissions, in a formal FERC complaint · Utility Dive, July 31, 2025
What the Market Monitor is warning
The case for a regional export “need” rests on assumptions the Monitor has repeatedly questioned. The plan assumes hundreds of billions of dollars in new, remotely located power plants that are not likely to be built6 — and a national appetite for distant generation that, two decades after it was forecast, has never materialized.10
The reason is structural. Utilities earn an assured return — on the order of ~10% a year — when they build and own power plants and transmission lines.7 But when a plant is built close to where the power is used, costly long-distance transmission is avoided. And unlike wind, solar — now the fastest-growing source of new generation9 — can be built almost anywhere. The economics point toward local generation; the incentives point toward building big.
New, remotely located power plants the planning case assumes — generation the Market Monitor warns is not likely to be built.
Source · MISO LRTP Futures Review, Sep 24 2024; IMM, Dec 1 2023 — note 6Of the new generation waiting in MISO’s active queue is solar, wind, storage, or hybrid — resources that can be built close to where the power is used.
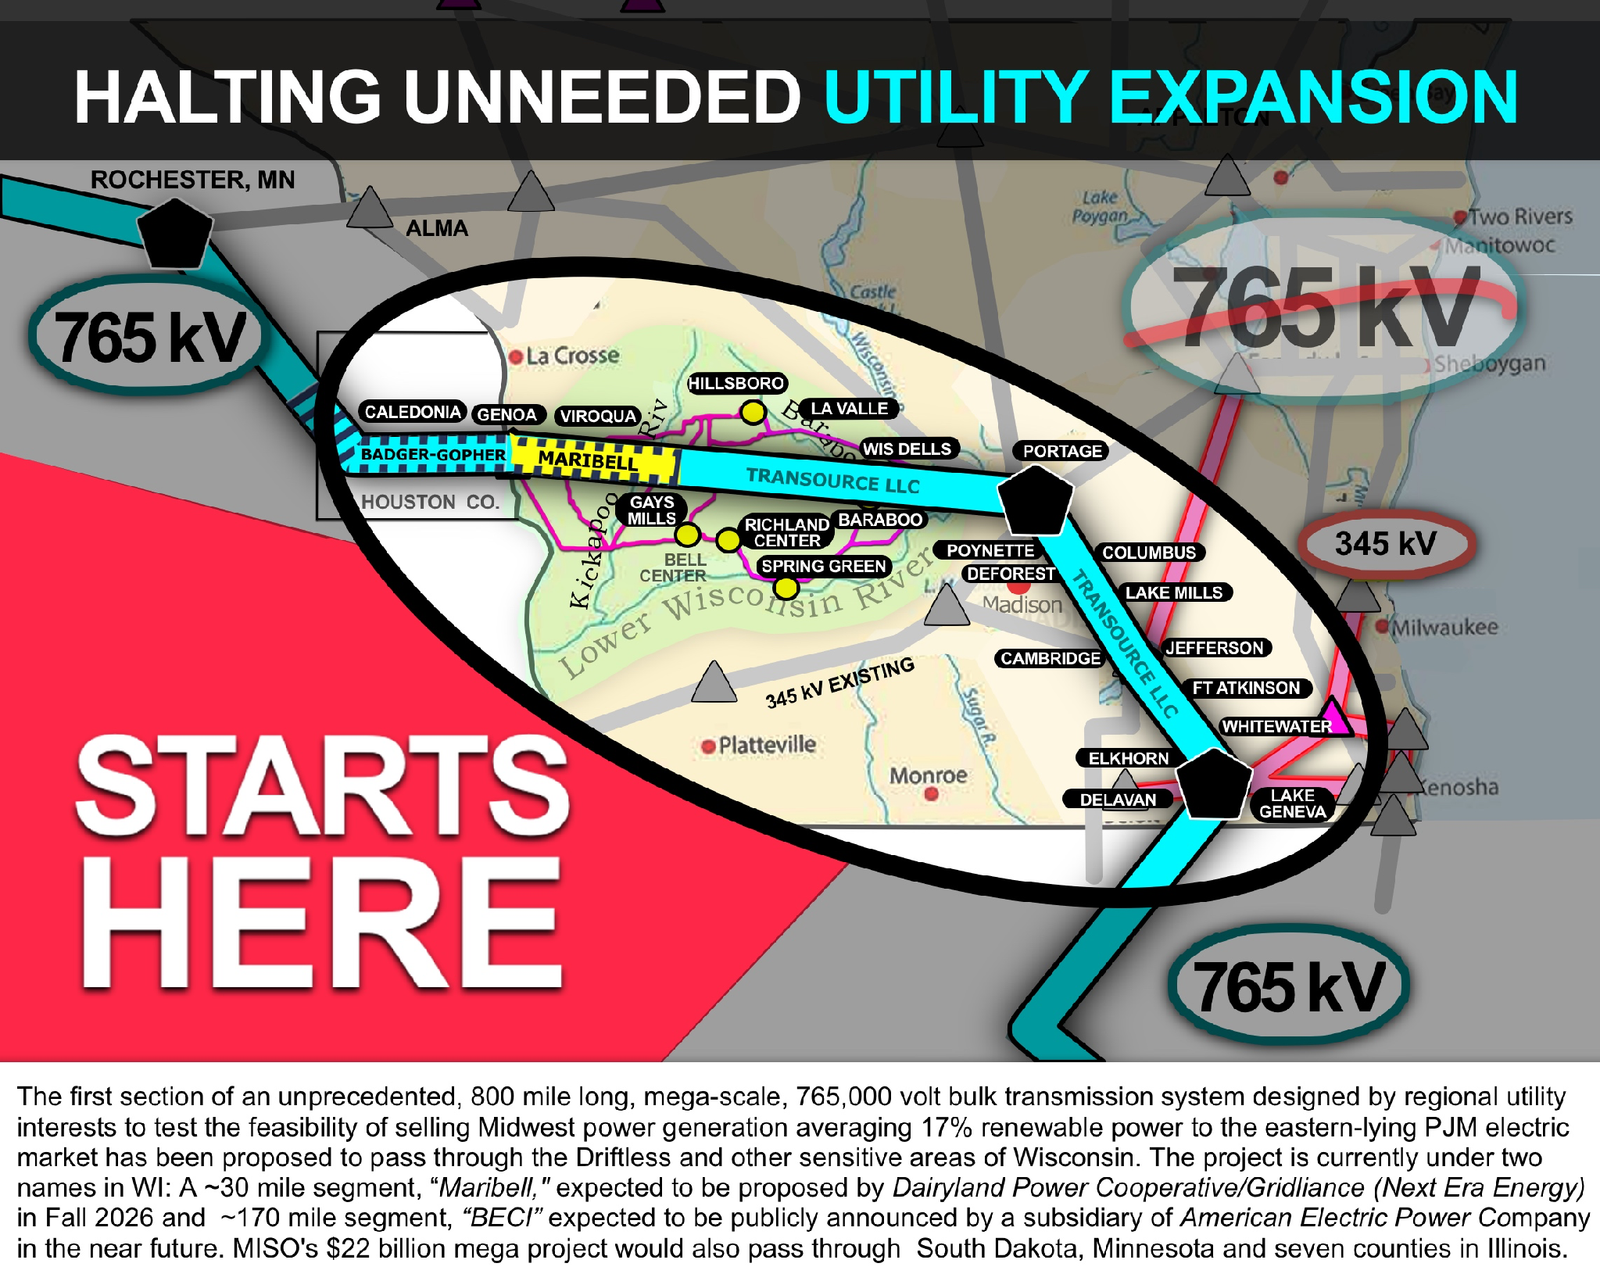
Source · MISO queue snapshot, May 25 2026 — note 11Estimated added cost to a typical Wisconsin residential bill to carry mega-scale lines built largely to send power out of state.
Source · No 765 Line estimate from MISO Tranche 2.1 cost figures & EIA WI customer counts — note 12What’s actually in the MISO queue today
Active interconnection requests by fuel type — MW (summer net), May 25 2026 snapshot. Solar + wind + storage + hybrid = 74% of active MW.
Source · MISO Generator Interconnection Queue snapshot, captured May 25 2026 (n = 1,081 active projects · 228,429 MW). More than half of all projects that ever entered this queue (2,127 of 3,783) have since withdrawn. See note 11.View data
| Fuel type | Active projects | Summer net MW |
|---|---|---|
| Solar | 378 | 70,033 |
| Battery Storage | 266 | 47,941 |
| Gas | 53 | 30,273 |
| Wind | 144 | 29,319 |
| Other / uncategorized | 125 | 28,615 |
| Hybrid | 115 | 22,248 |
| Total | 1,081 | 228,429 |
Building big is how utilities earn.
Utilities qualify for an assured ~10% annual return when they build and own plants and lines. Generation built close to load avoids costly transmission — but it earns less. The system rewards the most expensive option, not the most useful one.
Source · “Utility Returns on Equity: A Self-Fulfilling Prophecy?”, Synapse Energy Economics — note 7The exported power isn’t clean by any standard.
In 2024, renewable generation across Midwest market outlets averaged about 17%. At the 2014–2024 growth rate of roughly 1% a year, getting to 50% renewable would likely add more than $1 trillion to electric bills.
Source · 2024 MISO State of the Market Report (Potomac Economics), Table 1; R. Danielson, 2021 — notes 13–15Customer-side investment beats new plants.
Patton: utility-scale plants compete directly with cheaper, cleaner customer-side investment. Efficiency, conservation, and load management have driven the largest share of CO₂ cuts since 2005 — and pay for themselves several times over.
Source · IMM presentations to MISO; EIA, Oct 29 2018; Focus on Energy cost-effectiveness study — notes 16–17Where CO₂ reductions actually came from
U.S. power-sector CO₂ reductions, 2005–2017, by source
Source · “Sources of CO₂ Reductions 2005–2017”; U.S. EIA, Oct 29 2018 — note 16. Based on ~2%/yr avoided-growth baseline.Even if you believed in it, the technology is the wrong choice
Suppose you still thought massively increasing remote generation and bulk export lines could prove worthwhile over time. The regional utilities’ choice of 1960s-era, above-ground 765 kV technology would still set a needlessly destructive precedent — because a modern alternative is already approved and being built.
In 2023, the Iowa Utilities Board approved the SOO Green HVDC Link, a 350-mile underground high-voltage direct-current line from Mason City, Iowa, to Plano, Illinois, running largely along existing railroad corridors.18 It performs the same bulk-export function to the PJM market — so similar that its PJM interconnection sits only a few miles from Collins, where the 765 kV project would connect to PJM, too.

Wooden “H” pole, 161 kV
~70 ft high · ~100 ft corridor
The 161,000-volt lines already on the landscape today.
Co-located 765 kV & 161 kV
Up to 200 ft high · 250 ft corridor
Steel lattice towers two to three times the height of today’s lines.
Modern, buried HVDC
Along rail, highways & existing 345 kV
High-voltage DC underground — the alternative SB 1125 would require in congested corridors.
In recognition of the buried HVDC alternative — and the impacts a 765 kV system would impose on Wisconsin — State Senator Brad Pfaff and Representative Tara Johnson introduced SB 1125 in the 2025–26 session, a modern-transmission bill that would have prioritized burying mega-scale transmission in congested utility corridors using high-voltage DC. That bill did not pass before the session ended, but Wisconsin residents can ask their state senator and representative to support reviving the same approach. This is state legislative advocacy — separate from the PSC’s CPCN proceeding.
This is a signed analysis by Rob Danielson, a longtime regional-transmission researcher, written for No 765 Line. The figures and characterizations are his and the public record’s, sourced throughout. We don’t claim the grid never needs investment — we ask something narrower: whether this line, paid for largely here, holds up on cost, on need, and on the technology chosen.
Sources & notes
- D. Patton, Independent Market Monitor reports to the MISO Board (May 29, Jul 15, Aug 31, Oct 30, 2024) — misoenergy.org ↩
- Midcontinent Independent System Operator (MISO) overview.
- Cost-estimate derivation: $21.8B base × MISO cost-estimation multipliers — MISO Tranche 2.1 fact sheet
- Long-Range Transmission Planning (LRTP) Tranche 2.1 FAQ — misoenergy.org
- “Five utility commissions ask FERC to undo MISO’s $22B multi-value transmission portfolio,” Utility Dive, Jul 31, 2025 — utilitydive.com ↩
- MISO LRTP Futures Review, Sep 24, 2024 (slide 31); IMM, Reconciling Future 2A, Dec 1, 2023 ($234B Future 2A NPV). ↩
- “Utility Returns on Equity: A Self-Fulfilling Prophecy?”, Synapse Energy Economics — synapse-energy.com ↩
- “A data-driven look at rising U.S. electricity costs,” CATF, Mar 2026 — catf.us
- “Solar power generation drives electricity growth,” EIA — eia.gov ↩
- MISO Transmission Expansion Plan 2011 (MTEP11), Dec 2011. ↩
- MISO Generator Interconnection Queue. Active-queue figures in this article are computed from a locally preserved snapshot captured May 25, 2026 (n = 1,081 active projects; 228,429 MW summer net; 2,127 of 3,783 total projects withdrawn). Rob Danielson’s original annual-withdrawals chart draws on MISO’s interactive queue export accessed Mar 29, 2026 — misoenergy.org ↩
- WI cost estimate: ~14% regional share of the 20-year cost ÷ ~2.9M WI residential customers (43% cost share) ≈ $3,000, or ~$12.50/mo — EIA SEP tables for WI. ↩
- 2024 MISO State of the Market Report (Potomac Economics), Table 1 (15% wind, 2% solar) — potomaceconomics.com ↩
- 2014 MISO State of the Market Report, Table 1 (renewables 7% → 17%, 2014–2024).
- “MISO Ferments a $1.8 Trillion Energy Plan,” R. Danielson, 2021 — starkenergyplan.org
- “Carbon dioxide emissions from the U.S. power sector have declined 28% since 2005,” EIA, Oct 29, 2018 — eia.gov ↩
- “Study Finds Energy Efficiency Program Cost-Effective for Wisconsin,” Focus on Energy — focusonenergy.com ↩
- “SOO Green transmission… clears key hurdle with Iowa approval,” Utility Dive, Sept 2023 — utilitydive.com ↩